
How to Look Up Harford County Jail Population Data
There is no single live dashboard for the Harford jail population. The Detention Center page on the Sheriff's site posts the rated bed capacity and the facility's history, but not a running count. For a population figure, the better sources are the Sheriff's annual reports and the county budget, which report staffing and average population for a given year. National context comes from the federal Bureau of Justice Statistics and the Vera Institute of Justice.
When reading any number, check what it measures. Rated capacity is a fixed design figure. Population is a daily count. Average daily population, or ADP, smooths the daily swings over a year. A point-in-time count is one snapshot. Mixing these can make a jail look more or less full than it is, so the label matters as much as the number.
How often a figure updates depends on the source. A budget is yearly. An annual report covers a fiscal year. A point-in-time count reflects a single day. None of these refresh live the way an inmate roster does. For the most current status of one person, a custody search beats any population report, while a population report is better for the big picture.
Harford County Jail Capacity Overview
The Harford County Detention Center holds 820 beds. That figure is the posted rated capacity, not the current count. The official detention page does not publish a live population, so the current-population column reflects that gap. Capacity is the most solid county-specific number available.
| Facility | Rated Capacity | Current Population |
|---|---|---|
| Harford County Detention Center | 820 beds | Not publicly posted; varies daily |
The detention page that lists capacity also covers the facility's day-to-day operations.
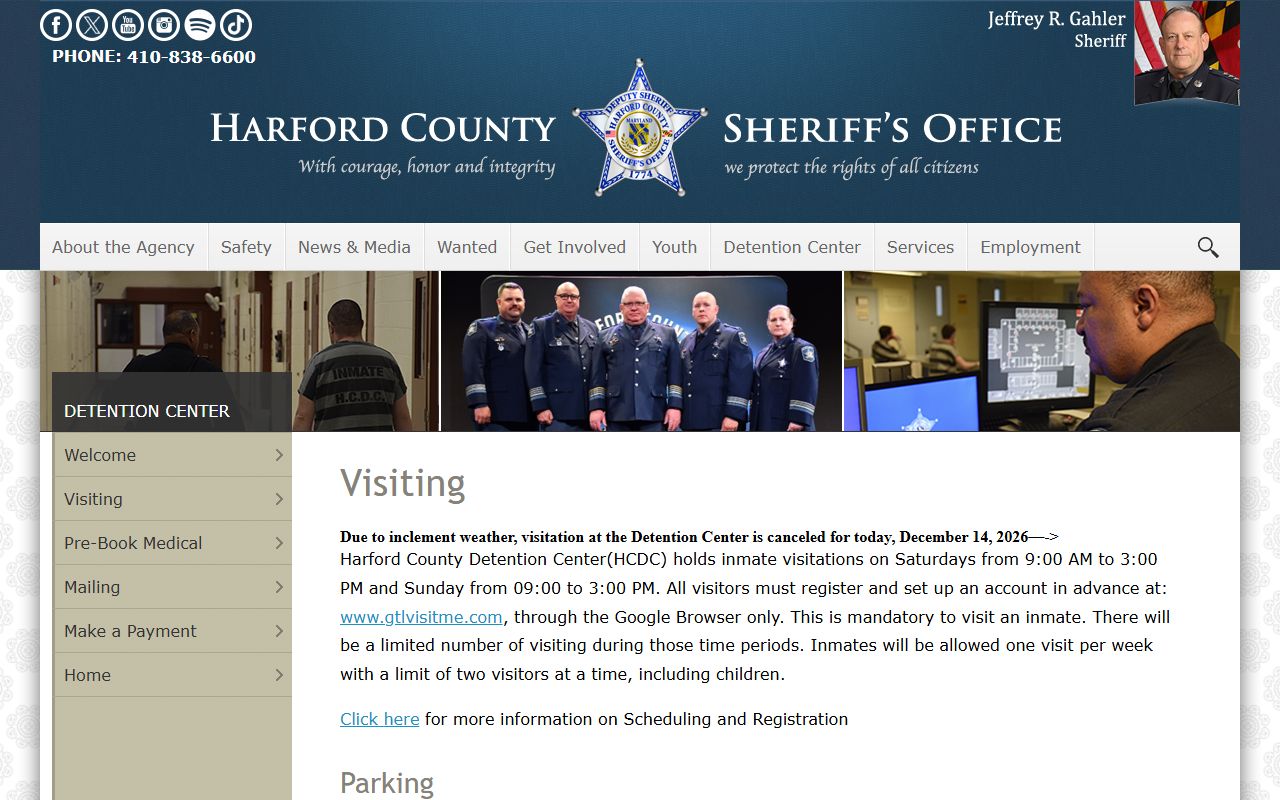
The Detention Center visitation page reflects the scale of an 820-bed jail, where visit slots, mail, and services all run on a set schedule. Those operations grow and shrink with the population the jail holds.
Why Capacity Is Not the Same as Population
A capacity of 820 beds does not mean 820 people are held. Population moves every day. Arrests add people. Releases, bonds, court commitments, and transfers remove them. A jail can sit well below its rated capacity or, at times, press against it.
Because Harford points the public to VINE for individual custody rather than a roster, a member of the public can confirm one person's status but cannot add up a full count from the website. For an average population over a year, the Sheriff's annual report and the county budget are the right sources. They report operational figures that a single web page does not.
Demographic Breakdown
A demographic breakdown shows the share of the population by gender, race, and age. Harford does not publish a current demographic table for the Detention Center in the official pages reviewed. Rather than estimate, treat this as a known data gap. The figures, when reported, appear in Sheriff annual reports, county budget documents, and federal jail surveys, not on the public detention page. Anyone who needs a verified breakdown should request it from the Sheriff's Office or pull it from a federal data series that samples county jails.
Pretrial vs. Sentenced Population
Jail populations split into two broad groups. The pretrial group is waiting for a case to resolve and has not been convicted. The sentenced group is serving a term, usually a shorter local sentence. Harford does not post the local split, so the table below defines the two statuses rather than guessing a percentage.
| Status | What It Means |
|---|---|
| Pretrial | Held while a case is pending; not yet convicted. Release may depend on bond. |
| Sentenced | Serving a sentence, typically shorter terms that stay at the county level. |
Nationally, jails hold a large share of pretrial detainees, a pattern federal research tracks year to year. The exact Harford split would come from the Sheriff's reporting, not a public dashboard.
Misdemeanor vs. Felony Population
Another way to view the population is by charge level. A misdemeanor is a less serious offense, while a felony is more serious and carries longer possible terms. County jails hold people on both, including those awaiting Circuit Court action on felony charges and those serving short misdemeanor sentences. Harford does not publish a misdemeanor-versus-felony breakdown for the Detention Center, so any figure should be drawn from official Sheriff reporting rather than estimated here.
Mental Health and Medical Population
Jails must provide medical and mental health care to people in custody. A share of any jail population needs ongoing care, from chronic conditions to mental health treatment. The Detention Center follows PREA guidelines and runs intake screening as part of booking. A specific count of the medical or mental health population is not posted on the public detention page, so that figure, where it exists, sits in internal reporting and oversight documents rather than a public dashboard.
The jail's mail page shows how tightly daily life is managed, which connects to health and safety policy.

The Detention Center mail page sets postcard and publication rules that apply to the whole population. Rules like these scale with how many people the jail holds.
National and State Context
To put a county jail in perspective, researchers use a rate per 100,000 residents. The Bureau of Justice Statistics runs an Annual Survey of Jails that reports national and state jail figures. The Vera Institute of Justice tracks county-level jail trends across the country. Harford does not post its own per-100,000 rate, so the comparison below marks the local figure as not published and points to the authoritative sources for the rest.
| Level | Jail Population per 100k |
|---|---|
| Harford County | Not publicly posted |
| Maryland | See Bureau of Justice Statistics |
| National | See BJS Annual Survey of Jails |
These sources report context, not Harford operational records. Use them to compare trends, and use Sheriff reporting for the county's own count.
Population Trends Over Time
The clearest documented Harford trend is capacity growth, not daily population. The Detention Center opened in 1973 with 100 beds, expanded to 474 in 1997, and added 288 beds in 2011 to reach 820. That growth tracks decades of rising demand for jail space in the county.
| Year | Capacity | Change |
|---|---|---|
| 1973 | 100 beds | Facility opens |
| 1997 | 474 beds | Major expansion |
| 2011 | 820 beds | Added 288 beds |
Capacity history is a real, sourced trend. Year-to-year population trends would come from annual reports, which report the operational figures the public page leaves out.
Searching for Harford County Inmate Records by Name
This page covers population data in the aggregate, not a single person. For a name-based custody search of the live jail, use the Harford County inmate records page, which explains the Maryland VINE tool and the Detention Center contact line.
Where the Data Comes From
Population figures, when they exist, come from official sources, not third-party sites. The Sheriff's Office posts the Detention Center's capacity and operational pages, including the payment system for inmate funds. The Sheriff's annual reports and the county budget carry staffing and average-population figures. For national and state context, the Bureau of Justice Statistics and the Vera Institute are the standard references.
The Detention Center payment page is one of the official operational pages on the Sheriff's site.

The Detention Center payment page handles inmate funds and shows the scale of services a large jail runs. Scheduling and visits route through a separate vendor system.
Visit scheduling uses the county's GTL platform, another sign of how the facility manages a large population.

The county's GTL visitation scheduling system handles weekend visit slots. These vendor tools and the Sheriff's reports, taken together, are the official window into how the jail operates.